Reale Portfolios zum Nachbilden (Europa, USA, Asien)
Erhalten Sie Zugang zu den konkreten Investmententscheidungen, die uns bekannt gemacht haben.
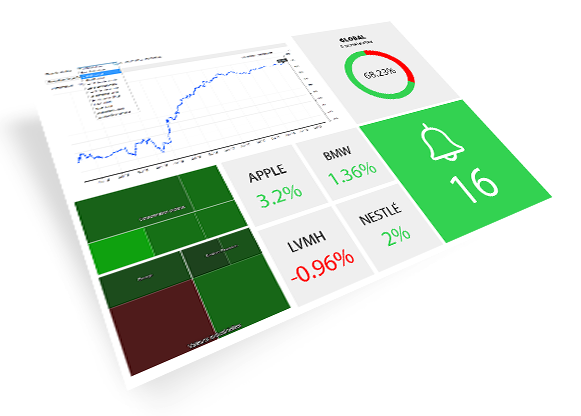
Verfolgen Sie in völliger Transparenz unsere Positionen und die Performance unserer drei aktiv verwalteten Portfolios in Europa, den USA und Asien. Unsere Ergebnisse sind real, nach Abzug von Brokergebühren und Transaktionssteuern.
Unsere Portfolios bestehen aus liquiden Unternehmen.
Die Werte werden nach Ländern und Sektoren diversifiziert, um das Risiko zu reduzieren.
Sie werden über jede von uns durchgeführte Transaktion informiert.
Im Schnitt zwei Transaktionen pro Monat und pro Portfolio.
*Die Wertentwicklung in der Vergangenheit ist kein Indikator für die zukünftige Wertentwicklung.
Eine weltweit einzigartige Datenbank
Unsere Datenbank ist die Referenz für anspruchsvolle Investoren. Gespeist aus den besten Quellen, deckt sie alle Märkte und sämtliche börsennotierten Instrumente ab. Ob Sie Ihr Portfolio verfolgen, einen Sektor beobachten oder neue Chancen suchen - unsere Plattform bietet Ihnen eine umfassende Übersicht an einem einzigen Ort.
Referenzmedium mit unvergleichlicher Informationstiefe
MarketScreener ist das führende Medium zur Beobachtung der Finanzmärkte. Profitieren Sie von unserer Unabhängigkeit und Expertise mit einem globalen 360-Grad-Blick - auf Aktien, ETFs, Sektoren, Wirtschaft, Indizes, Devisen, Kryptowährungen, Rohstoffe und mehr.
Jeden Monat von Millionen Anlegern in über 90 Ländern genutzt, ist unser Informationsangebot weltweit anerkannt für seine Robustheit, Schnelligkeit, umfassende Abdeckung und seinen Mehrwert.
Verschaffen Sie sich einen Überblick mit unseren Artikeln, Analysen und Hintergrundberichten - verfasst von unserem Team aus Journalisten, Analysten und Wissenschaftlern, allesamt Experten der Finanzmärkte.
Verfolgen Sie die Märkte in Echtzeit mit Newsfeeds aus den besten globalen Quellen - verfügbar in sieben Sprachen und automatisch übersetzt für eine sofortige Lektüre.
Nutzen Sie die umfangreichste online verfügbare Dokumentationsdatenbank. Greifen Sie auf eine unvergleichliche Informationsfülle und -tiefe zu, um Ihre Werte und Branchen zu verfolgen oder gezielt interessante Unternehmen aufzuspüren.
Profitieren Sie von der kompakten Arbeit unserer Journalisten, die früh aufstehen und spät schlafen gehen, um Sie zuverlässig zu informieren und Ihnen wertvolle Zeit zu sparen.
Die Experten von MarketScreener erstellen täglich Analysen und Aktienempfehlungen. So können Sie Unternehmen entdecken - oder wiederentdecken -, in die es sich zu investieren lohnt oder die man besser meidet.
Verfasst von unserem Expertenteam, helfen Ihnen unsere Hintergrundartikel dabei, fundierte Entscheidungen zu treffen - und unsere eigenen Entscheidungen nachzuvollziehen.
Wir wählen Qualitätsunternehmen aus - also Firmen, die wachsen, Gewinne erzielen, ohne sich übermäßig zu verschulden, und die im Verhältnis zu ihren Wettbewerbsvorteilen angemessen bewertet sind. Die Zeit spielt ihnen in die Karten.
Wir verfolgen kontinuierlich 70 Investmentthemen, die entweder die Schlagzeilen bestimmen oder langfristigen Megatrends entsprechen.
Entdecken Sie unsere Watchlists in Form von Portfolios - mit ihrer Performance sowie ihrer sektoralen und geografischen Ausrichtung. Jedes Thema wird ausführlich erläutert, und die Unternehmenslisten werden regelmäßig aktualisiert.
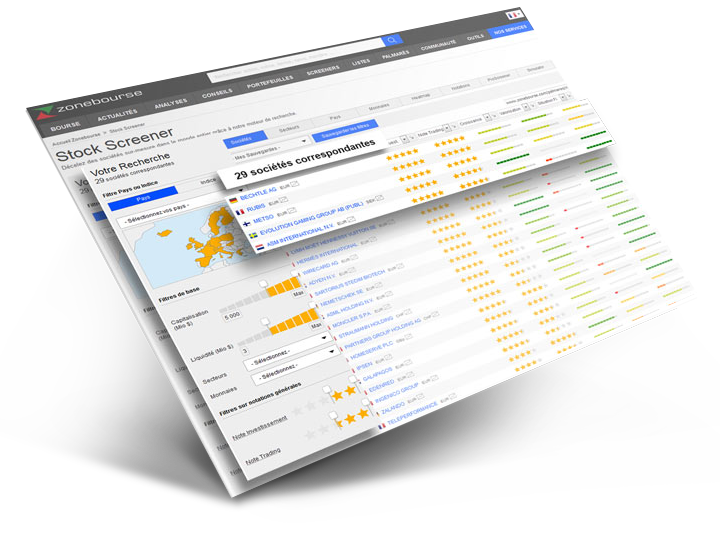
Der leistungsstärkste AktienScreener auf dem Markt
Der wahrscheinlich leistungsstärkste AktienScreener auf dem Markt.
Analysieren Sie in wenigen Sekunden alle börsennotierten Unternehmen weltweit - über alle Sektoren, Indizes und Währungen hinweg.
Über 650 fundamentale und technische Kriterien - perfekt abgestimmt auf Ihre Anlagestrategien.
Filtern Sie nach Hunderten von Finanz-, Konsens-, technischen oder ESG-Kriterien und erhalten Sie so einen 360°-Blick auf die analysierten Unternehmen.
Verfolgen Sie Ihre Werte oder importieren Sie Ihre Daten, um Ihre Investments mit unseren Tools, Datenbanken und aktuellen Nachrichten effizient zu steuern:
Erstellen Sie bis zu 10 Listen mit jeweils 50 Werten, um Ihre Lieblingsunternehmen im Blick zu behalten - mit Kursen in Echtzeit, Unternehmensnachrichten, Ergebnisveröffentlichungen, Veränderungen der Schätzungen und Broker-Empfehlungen.
Stellen Sie Ihre Benachrichtigungen ein, um keine einzige Information zu verpassen.
Wie große Investoren und professionelle Analysten erhalten Sie direkten Einblick in die Unternehmen, indem Sie auf die Transkripte von Ergebnisveröffentlichungen, Investorenkonferenzen oder Unternehmenspräsentationen zugreifen.
Jede Transkription ist klar strukturiert und so aufbereitet, dass Sie mühelos zwischen den Ausführungen des Managements und den Fragen der Analysten oder Investoren navigieren können.
Ebenfalls enthalten sind eine Analyse der inhaltlichen Positivität sowie ein Ranking der verwendeten Schlüsselbegriffe.
Stets aktuell und ideal für die Fundamentalanalyse sowie zur Generierung neuer Investmentideen. Ob für den sofortigen Einsatz oder im späteren Meeting - sie lassen sich speichern, drucken, kommentieren und weitergeben.
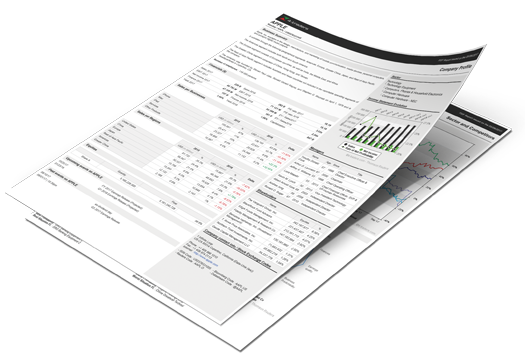
Zum Download verfügbar und für über 60.000 börsennotierte Unternehmen erhältlich, bieten die kompakten 6-seitigen Berichte alle detaillierten Informationen und vermitteln einen umfassenden Überblick über jedes einzelne Unternehmen:
Das Access-Abonnement richtet sich an anspruchsvolle unabhängige Anleger, die auf der Suche nach hochwertigen Informationen und Daten sind. Ihr Access-Abonnement beinhaltet viele Vorteile:
Unbegrenztes Navigieren ohne Werbeblocker, mit uneingeschränktem Zugriff auf alle MarketScreener Nachrichten, Artikel und Analysen
Kostenloser wöchentlicher Newsletter: Das Börsen-Update der Woche
Gratis Download von unserem Leitfaden für Anleger, den Sie einfach in Ihrem MarketScreener-Konto finden
Ein Kundenservice, der Sie bei Fragen und Problemen unterstützt
Kostenlose Nutzung der kostenpflichtigen iPhone-App von MarketScreener
Zugang zu zahlreichen thematischen Aktienempfehlungen und Aktien nach Anlagestil
Nutzung des fortschrittlichsten Aktienscreener auf dem Markt, mit dem Sie alle Unternehmen klassifizieren und vergleichen können
Exklusives Scoring von Unternehmen, um einfach diejenigen Unternehmen zu entdecken, die sich für lang- oder kurzfristige Investitionen eignen (Investment- und Trading-Score verfügbar über unseren Aktienscreener). Das Scoring wird nach zahlreichen Kriterien erstellt (Wachstum, kurzfristige/ langfristige EPS-Bewertung, finanzielle Situation, Rentabilität, Veröffentlichung und Sichtbarkeit etc.)
Download von Finanzberichten (im PDF-Format) zu allen weltweit börsennotierten Unternehmen
Erstellung von personalisierten Watchlists (10 * 50 Aktien)
Umfassender Zugang zu virtuellen Portfolios (10 * 50 Aktien)
Zugriff auf Hunderte von fundamentalen Kennzahlen
Fundamentaldaten von höchster Qualität: Wir arbeiten zusammen mit den weltweit zuverlässigsten und anerkanntesten Finanz- und Börsendatenanbietern (Refinitiv, S&P Global, MorningStar, Factset, etc.)
Was ist in meinem Premium-Abonnement enthalten?
Das Premium-Abonnement richtet sich an Anleger, die unsere Meinungen und Entscheidungen an der Börse mitverfolgen möchten.
Ihr Premium-Abonnement beinhaltet viele Vorteile:
Alle Tools, Produkte und Inhalte des Access-Abonnements
Unbegrenzter Zugriff auf alle Empfehlungen und Analysen unserer Experten, um die Performance Ihrer Anlagen zu optimieren
Zugang zu den 3 real investierten Portfolios (USA, EU, Asien), um unsere Entscheidungen verfolgen bzw. kopieren zu können und um Ihnen zu helfen, die Märkte zu schlagen
Unbegrenzte Nutzung des erfolgreichsten Aktienscreener auf dem Markt
Unbegrenzte Downloads der automatischen Finanzberichte (im PDF-Format) aller weltweit börsennotierten Unternehmen
Wöchentlicher Newsletter: Premium-Report, das Portfolio-Update der Woche
Dieses Paket wird Ihnen helfen, die Performance Ihrer Investitionen zu optimieren und die Märkte zu schlagen.
Was ist in meinem Expert-Abonnement enthalten?
Das Expert-Abonnement richtet sich an Anleger, die Entscheidungshilfen für Anlageexperten suchen.
Ihr Expert-Abonnement beinhaltet viele Vorteile:
Alle Tools, Services und Inhalte des Premium-Abonnements
Persönliche telefonische Beratung und Begleitung (in englischer Sprache)
Zugang zur Aktienscreener Pro Version
Zugriff auf den Event Screener
Unbegrenzte automatische Generierung von Finanzberichten (Download im PDF-Format) aller börsennotierten weltweiten Unternehmen sowie die Möglichkeit, diese individuell mit Ihrem Logo anzupassen
Diese Produkte werden Ihnen helfen, neue Höhen in der Performance Ihrer Anlagen sowie im Verständnis des Marktes zu erklimmen.
Was rechtfertigt den Preis Ihrer Abonnements?
MarketScreener offeriert das beste Verhältnis von Quantität, Qualität und Preis.
Andere Unternehmen mögen billigere Abonnements anbieten, aber keines von ihnen liefert einen so umfassenden Service für Investitionen am Aktienmarkt, wie MarketScreener:
Alle weltweiten Börsennachrichten in Echtzeit
Exklusive Inhalte mit hohem Mehrwert einschließlich unserer Analysen und Empfehlungen
Eine beispiellose Datenbank, die mehr als 99,9 % der weltweit börsennotierten Unternehmen abdeckt
Die besten Aktienmarkt-Analysen und Screening-Tools als Instrumenten-Koffer für Investitionen am Aktienmarkt
3 Portfolios (USA, EU, Asien), die real investiert sind, damit Sie unsere Investitionen und unsere Performance-Niveaus, welche die Weltmärkte übertreffen, einfach nachbilden können
Die vollständigste Börsen-App auf dem Markt
MarketScreener bietet den Nutzern klare, benutzerfreundliche, hochwertige und detaillierte Daten, damit Sie den Markt übertreffen und zu dem Anlegertyp werden, der Sie sein möchten.
Wie schaffen Sie es, so viele Tools und qualitativ hochwertige Inhalte anzubieten?
Wir sehen es als unsere Mission, alle Anleger mit qualitativ hochwertigen Informationen zu versorgen, die auf zuverlässigen Daten basieren. Seit 2001 im Geschäft, haben wir die letzten 20 Jahre damit verbracht, diejenigen Tools zu entwickeln, die Sie und wir brauchen, um die Märkte zu beobachten und zu analysieren sowie unsere Portfolios wachsen zu lassen.
Deshalb sind unsere Tools so nützlich und effizient, weil sie auf den konkreten Bedürfnissen aller informierten Anleger basieren.
In Bezug auf die Qualität unserer Inhalte haben wir unsere Analysten- und Journalistenteams auf- und ausgebaut, um unseren Kunden täglich exklusive, hochwertige Inhalte zu liefern. Bei MarketScreener ist jedes Teammitglied ein Experte auf seinem Gebiet ist.
Kann ich von mehreren Plattformen aus auf MarketScreener zugreifen?
Ja, Sie können auf marketscreener.com über die mobile Website, die Desktop-Website und die mobile iOS-Anwendung (kostenlos ab dem Access-Abo) zugreifen.
Kann ich mit einem einzigen Abonnement auf alle MarketScreener-Editionen (Deutschland, Schweiz, USA, UK, Frankreich, Italien, Niederlande etc.) zugreifen?
Jede internationale Edition wird als eigenständige Website betrachtet, mit exklusiven Inhalten, angepassten Nachrichten und Highlights (Kurse, Märkte usw.), die auf die jeweilige Edition abgestimmt sind. Dennoch bieten wir allen Kunden die Möglichkeit, auf alle unsere internationalen Editionen zuzugreifen, indem Sie sich ganz einfach mit dem Login und Passwort ihrer ursprünglichen Edition einloggen.
Wie viele Aktien, Indizes, Börsennotierungen decken Sie ab?
Sie haben Zugang zu den umfassendsten Finanz- und Börseninformationen auf dem Markt, die mehr als 99,9 % der weltweit börsennotierten Unternehmen abdecken. Unsere Ratings und Analysesysteme, sowohl technisch als auch fundamental, werden täglich für fast 20.000 Unternehmen aktualisiert. Wir decken auch rund 10.000 ETFs und mehr als 280.000 Indizes sowie alle Arten von Börsennotierungen (Devisen, Kryptowährungen, Rohstoffe etc.) ab.
Wer ist Ihr Datenlieferant?
Wir arbeiten mit allen weltweit anerkannten und zuverlässigen Anbietern von Finanz- und Börsendaten zusammen, wie z.B. Refinitiv, S&P Global, MorningStar, FactSet und vielen anderen.
Was kann ich tun, wenn ich Probleme mit meinem Abonnement habe?
Sie können uns jederzeit kontaktieren. Unser Kundenservice steht Ihnen während der Geschäftszeiten zur Verfügung, um alle Ihre Fragen zu beantworten. Unsere realen Experten unterstützen Sie bei der Nutzung der Website, um die Performance Ihrer Investitionen zu optimieren.
Was kann ich tun, wenn ich mein Abonnement stornieren möchte?
Wir akzeptieren derzeit alle Kredit- und Debitkarten wie MasterCard, Visa, American Express, Gpay und Apple pay. Wir akzeptieren auch PayPal. Alle Zahlungen werden sicher über Stripe oder PayPal abgewickelt.
Wie kann ich mein Abonnement hochstufen?
Sie können Ihr Abonnement ganz einfach hochstufen, indem Sie auf unsere Abonnement-Seite gehen: https://de.marketscreener.com/services/solutions/, hier das gewünschte Abonnement auswählen und Ihre Zahlung bestätigen.
Welches Abonnement gibt mir Zugang zu den Basis-Inhalten?
MarketScreener ist ein auf Finanz- und Wirtschaftsnachrichten spezialisiertes Medium. Es bietet Zugang zu vielen verschiedenen Arten von Inhalten und Tools: Artikeln, Analysen, Empfehlungen, Videos, Screener, Transkripte etc. Sie haben die Wahl zwischen drei Abonnement-Stufen: Access (Basis), Premium und Expert.
Wie kann ich Benachrichtigungen per E-Mail und/ oder SMS erhalten?
Mehrere Benachrichtigungen (E-Mail / SMS) stehen zur Auswahl - je nach Abonnement:
Premium-Report: Erhalten Sie jeden Dienstag das wöchentliche Update zu unseren drei realen Investor-Portfolios.
Investorportfolio Europa / USA / Asien: Erhalten Sie Benachrichtigungen in Echtzeit zu sämtlichen Trades.
Börsen-Update der Woche: Erhalten Sie jedes Wochenende unseren wöchentlichen Marktbericht über die verschiedenen Anlageklassen.
Fonds Europa One: Erhalten Sie den monatlichen Bericht zur Entwicklung des Aktienfonds Europa One, für den MarketScreener exklusive Anlageempfehlungen gibt.
Derivate-Analysen: Erhalten Sie in Echtzeit unsere Empfehlungen zu Knock-Outs und Optionsscheinen.
Watchlists: Erhalten Sie E-Mail-Benachrichtigungen zu Ihren gespeicherten Aktienlisten.
Alle Benachrichtigungen können unter Mein Mitgliedskonto > Meine Benachrichtigungenaktiviert / deaktiviert werden.
Wenn mein Abonnement endet, verliere ich dann meine Listen, Portfolios etc.?
Wenn Ihr Abonnement abgelaufen ist, verlieren Sie den Zugang zu den Tools und Inhalten, die mit Ihrem Abonnement verbunden sind. Ihre Listen, Portfolios usw. werden jedoch nicht gelöscht und Sie können jederzeit mit einem aktiven Abonnement wieder darauf zugreifen.
Wie kann ich mein Konto löschen?
Da der Schutz und die Verwaltung/ Kontrolle Ihrer persönlichen Daten zu unseren zentralen Anliegen gehören, können Sie jederzeit und ganz einfach über unser Kontaktformular die Löschung Ihres Kontos beantragen.
Unser Kundenservice wird sich zeitnah um Ihr Anliegen kümmern und Sie erhalten eine Bestätigung per E-Mail.
Haben Sie noch weitere Fragen?
Wir hoffen, dass Sie die Antworten gefunden haben, nach denen Sie gesucht haben. Sollten Sie noch Fragen haben, wenden Sie sich bitte an unseren Kundenservice, der aus echten Menschen besteht, die Experten für Finanzen oder ihr jeweiliges Fachgebiet sind und denen es am Herzen liegt, all Ihre Fragen qualitativ hochwertig zu beantworten.
Sie sprechen über uns
Meinungen von Nutzern
J
Jonathan35 Trader
Für einen Anleger wie mich, dem Fundamentaldaten ganz wichtig sind, ist Marketscreener ein sehr leistungsstarkes Tool mit einem Screener, der die besten Aktien aufspürt, riesigen Finanzdaten und Aktienübersichten im pdf download. Die Investor-Portfolios geben mir Ideen, wen ich für meine Anlagen übernehmen kann (oder nicht), und die Artikel sind interessant verfasst. Ich möchte nicht mehr darauf verzichten!
d
dirk diggle
Ich hatte eine unglaubliche Chance, Marketscreener zu entdecken! Als völliger Neuling habe ich viel gelernt, dank der vielen Daten und eines großartigen Teams, das immer zur Verfügung steht. Ich denke, dass dies die beste Börsenseite ist (aussagekräftige Charts, alle Nachrichten, der leistungsstarke Aktienscreener, verschiedene technische Analysen und Reiter). Danke!
O
Osterman
Das einzige Finanzmedium, über das man Fachleute erreichen kann, die sich bemühen, immer erreichbar zu sein. Meine Lehrmethoden konnten sich dank der Unterstützung durch den Kundenservice weiterentwickeln und haben es mir ermöglicht, meinen Ansatz zur Vermittlung von Finanzmarktwissen zu ändern. Die Nutzung eines Mediums verändert die traditionelle Sichtweise der Ausbildung von Finanzfachleuten grundlegend.
R
Ralf G. Spezialist Small Caps
Marketscreener ist DIE Referenz in Deutschland für Informationen und News über die Börse und die Finanzmärkte im Allgemeinen geworden. Ein Bloomberg für alle!
S
Scheibling
Ich bin mit der Website sehr zufrieden, die ich schon seit den 2000er Jahren nutze. Ich denke es ist die beste Börsenseite die es aktuell gibt. Sie ist gut gemacht mit super Charts, alle Nachrichten ständig aktualisiert, es gibt technische Analysen und einfach alles.
C
CG
Sehr umfassende Webseite, Realtime-Kurse, Nachrichten etc. Perfekt, um seine Investitionen zu verfolgen.
L
Laura44
Unentbehrliche Seite, um gute Entscheidungen zu treffen!
J
Juli P.
Ich finde bei Marketscreener die Finanzinformationen, die ich brauche, und ich schätze den Bericht zum Europa One Fonds.
J
Jojoo
Gute Aktientipps, gute Begleitung bei Problemen durch hilfsbereite und kompetente Mitarbeiter.
F
FRIEDRICH Georg
Seriöse und gut dokumentierte Webseite. Die Charts sind einfach zu konfigurieren.
M
Marie-Luise JAKOBS
Ich bin mit dem Kauf von BE Semiconductor, wie empfohlen, zufrieden. Dieses Unternehmen verdient es, langfristig empfohlen zu werden...Danke.
d
derhy
Eine toll Seite mit Börseninformationen und vielen Entscheidungshilfen. Anpassbare und intuitive Screener. Eine vollständige Aktienübersicht und Analysen von Unternehmen und Branchen. Ich empfehle diese Seite wärmstens. Sie ist ein Muss.
H
H. Schwarzer
Ich schätze die breit gefächerten Inhalte der Webseite und den Screener. Die Funktionen sind super. Ansonsten sind die Informationen gut aufbereitet und wenn man eine bestimmte Info sucht, findet man sie auch.
H
Honegger
Marketscreener ist heute eine der umfassendsten Websites für die Beobachtung der Aktienmärkte. Sie bietet eine Fülle von Börsennews, die pdf-Berichte über die Wertpapiere sind sehr umfassend, aber ich würde Ihre technischen Analysen mehr hervorheben, als Anregung.
P
Paul Paule
Ich bin mit der Website von marketscreener sehr zufrieden, so viele Informationen an einem Ort! Ich denke, das ist einzigartig und spart viel Zeit, was ich sehr schätze.
T
Tommy07
Ich schätze die Vollständigkeit der angebotenen Informationen; die von MS abgegebenen Empfehlungen und Analysen zu den Wertpapieren scheinen mir transparent zu sein.
M
Matthias H.
Die (vielleicht) umfangreichste Website für Börseninformationen. Ein extrem breites Spektrum an Unternehmen, die analysiert werden. Screener, die eine bemerkenswerte und effiziente Innovation darstellen. Ein großes Lob. Weiter so!
M
Micama
Das ist die einzige Website, die ich gefunden habe, die so umfangreich ist. Wenn man ein wenig sucht, findet man alles, was man sucht. Ich bin nur etwas enttäuscht, dass Ihre Investorportfolios in 2022 nicht besser gelaufen sind... Aber niemand hat eine Kristallkugel, auch nicht die Besten!
Sie arbeiten mit uns zusammen
Monats-Abo
Jahres-Abo
-40%
Access
Informationen, News und Daten - für unabhängige Anleger
Access
-40% *
17
29€€/Monat
17
29€€/Monat
Informationen, News und Daten - für unabhängige Anleger
40 % Rabatt auf jedes neue Jahres-Abonnement, das zwischen dem 7. September und 20. September 2026 abgeschlossen wird. Dieses Angebot gilt nur für MarketScreener-Mitglieder ohne ein aktuell laufendes Abonnement. Der Rabatt bezieht sich nur auf die erste Zahlungsperiode (das erste Jahr). Nach Ablauf wird das Abonnement zum normalen, um bis zu 20 % reduzierten Preis, verlängert - sofern nicht gekündigt. Dieser Rabatt kann nicht mit anderen laufenden Angeboten oder Aktionen kombiniert werden. Ermäßigung verglichen mit einem Monats-Abonnement (12-monatige Laufzeit und monatliche Rechnungsstellung).